By Britanny Baporis and Andrew Jacober
Britanny Baporis is a senior at UNC-Chapel Hill double majoring in Environmental Science and Geography.
Andrew Jacober is a senior at UNC-Chapel Hill majoring in Environmental Science with a minor in Computer Science.

According to the Smart Cities Council a “smart city” is defined as one in which information and communication technology enhances the livability, workability and sustainability of that specific place. Increasingly how “smart” a city is affects how it is viewed by businesses looking to locate new facilities and even impacts how residents and visitors view the quality of life in the city.
In the fall of 2017 we were part of a team of undergraduate students at Carolina who set out to learn both the state of cleantech projects in the Triangle through municipal data collection and how the cities in the Triangle would fare when measured against a metrics system for analyzing smart cities.
As part of this project, conducted in consultation with the Research Triangle Cleantech Cluster, we undertook a comparative smart city analysis of the four cities: Cary, Chapel Hill, Durham and Raleigh and gathered data regarding recent smart city projects within each municipality.

The City of Raleigh has several initiatives underway that make it a “smart city.” (Photo via Smart Cities @ NC State University)
We then created a database to manage this cleantech data and planned to provide a visual guide to the data by creating a smart city asset map. This map was designed to present all smart city projects confirmed by each municipality in a way to highlight the current smart city advancements in the Triangle region.
We developed this map using the Google Maps API, HTML and JavaScript to provide the visualization of the data. All data collected was stored in a Postgres database and the website was built on Django, a Python-based web framework.
The project was intended to provide these cities with a benchmark assessment of their progress toward becoming a “smarter” city and as an aid to improve the quality of life and strengthen the services provided to residents. Both the comparison and asset map allow for communication and collaboration between municipalities through the assessment of a city or town’s strengths and weaknesses and the projects that got them to where they are.
Our team’s smart city analysis was based on specific metrics, which are quantitative, calculable indices used to determine the “smartness” of a city. We collected data for all four of the cities through online research and interviews with local government employees.
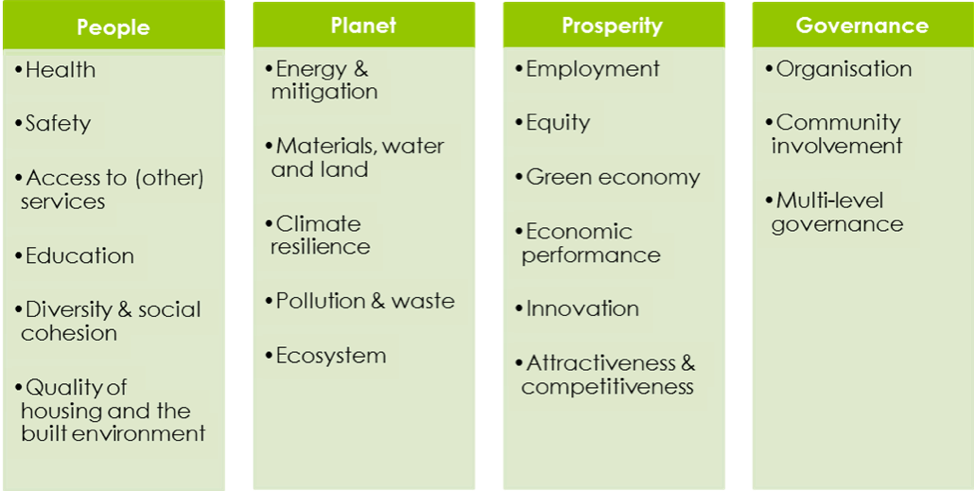
The metrics we utilized focuses on four main categories of municipal responsibilities of Planet, Governance, People, and Prosperity and the subcategories under each main heading.
The website additionally highlights one project in each of the four major municipalities that exemplifies the strongest use of technology to provide services that ultimately improve the quality of life of residents.
Some of our initial findings included:
- There is ample room for collaboration within the Triangle to improve the “smartness” of the region, which could be facilitated through municipal implementation of cleantech projects shown on the asset map we developed. For example, Raleigh does extremely well in the governance category and could aid Cary in implementing connectivity projects that would increase communication between the citizens and the government.
- Durham scored on the lower end of our comparison due to poor data availability. Since this analysis was so dependent on numeric values, a relative lack of data hurt Durham’s scores.
- The concept of a smart city is an ever-evolving idea that results in an iterative process of innovation and improvement, requiring constant work towards creating the best living environment for people.
The full Smart Cities Capstone report can be found here:
https://ie.unc.edu/files/2017/12/Fall2017_ENEC698_smart_cities_final_report.pdf